Black Friday is usually one of the biggest retail events of the year for many brands. However, as we’re all painfully aware, there is nothing ‘usual’ about 2020.
Given the chaos that the pandemic has caused, what do brands predict for Black Friday 2020? To find out, we canvassed them on LinkedIn. And this was what we learned:
- 67% say that they’re plannning a whole month of deals
- 14% are planning about the same as last year
- 11% are cancelling Black Friday
- 8% are combining Black Friday with their Christmas deals
Whether brands are planning to stick to Black-friday-as-usual or are plotting a month-long extravaganza, there’s a lot we can glean from past year’s activity to predict how shoppers might act – and plan campaigns around it.
We analysed our Black Friday data from 2019 to predict shopper behaviour
So what intellgence can we use from previous Black Fridays to help retailers embrace this important retail event – and maybe even claw back sales lost to COVID-19?
Here’s what our data tells us about visitor behaviour during Black Friday in 2019 in the UK. (Unless otherwise, all data refers to the two week period from 25/11/19 – 08/12/2019.)
Black Friday visitor behaviour
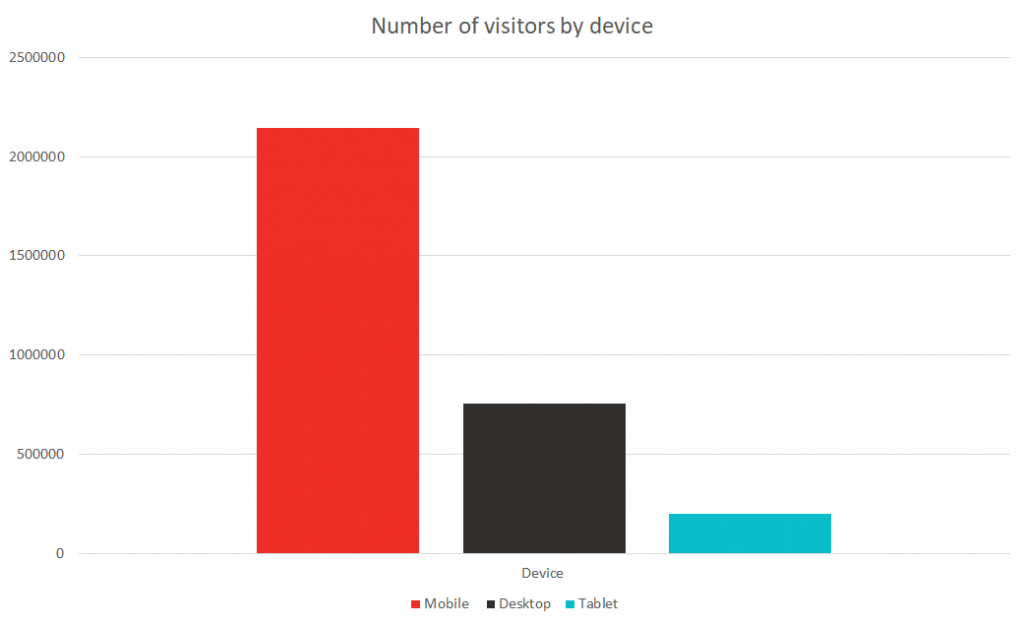
Over the two-week period, the majority of potential customers (69%) visited retailers websites using a mobile device – this was followed by desktop and then tablet.
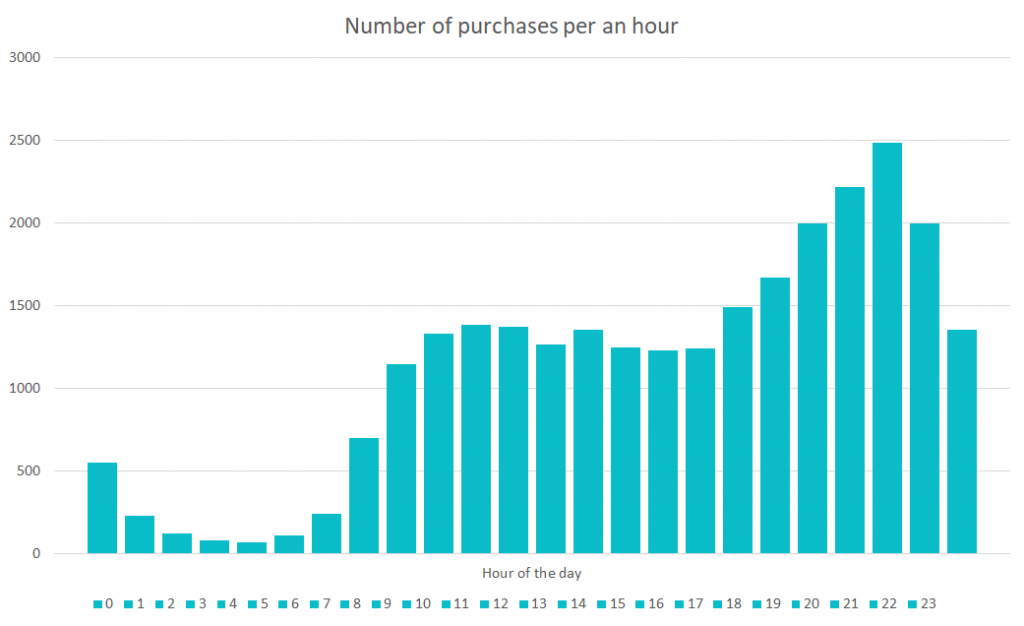
We saw the largest number of visitors between the hours of 7pm-9pm; typically when customers are at home, during the period between dinner and going to bed.
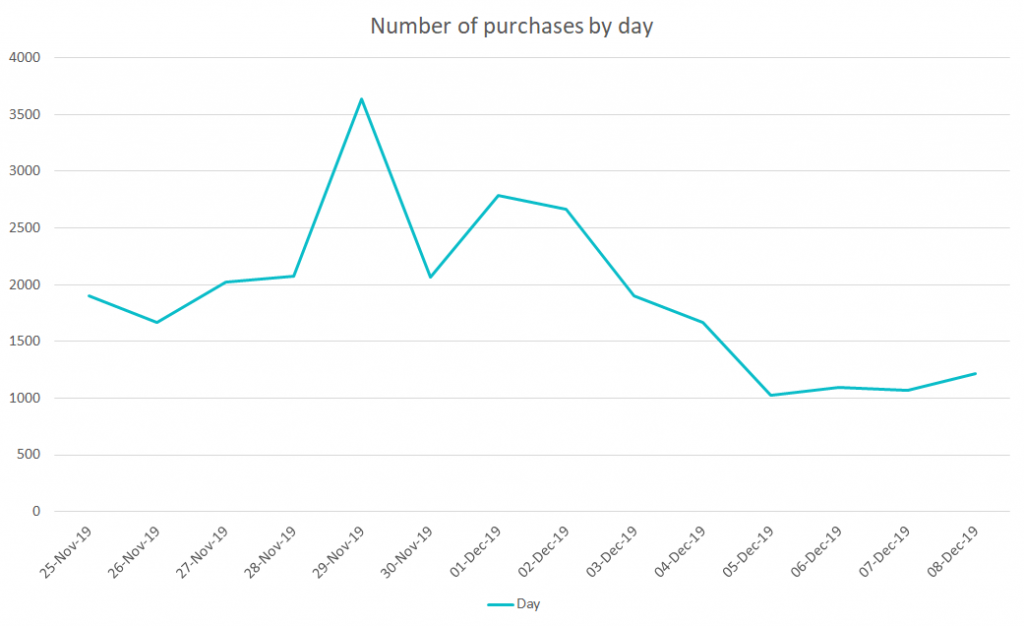
Black Friday, the Sunday after Black Friday and Cyber Monday saw the highest number of customers visit the retailers’ sites. The days following Cyber Monday saw a gradual decline in the number of visitors, with a slight increase at the end of the week on Friday.
Black Friday customer purchase habits
Out of the entire two-week period, 41% of all purchases were made on Black Friday weekend. Mobile continued to be the most popular device for customers, accounting for 65% of purchases.
Peak hours for the highest number of purchases were between 7pm-10pm, which is unsurprising as is was also the part of the day that saw the highest number of visitors. The early hours of the morning saw the lowest number of purchases. This started picking up 7am and continued to rise.
As would be expected, Black Friday was the highest performing day for the number of purchases. The Saturday after Black Friday we saw a lull in the number of purchases, before picking up again on the Sunday after Black Friday and Cyber Monday.
Average Black Friday order value
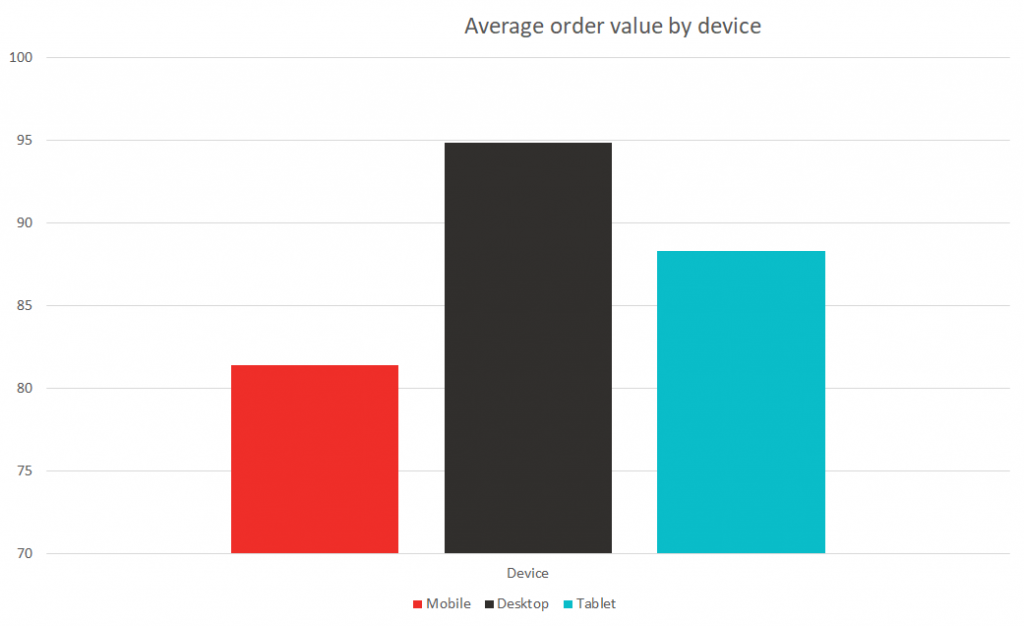
Although Mobile was the most popular device for both making purchases and visiting retailers websites, purchases using desktops saw a higher average order value – this was 17.6% higher than mobile and tablet.
Over the period of a day there was only a 20% difference in the average order value from the highest performing hour and the lowest.
The top performing hours of the day over the two week period were in the early hours of morning (12am, 2am and 5am). Over the Black Friday weekend, however, we saw a sharp increase in the average order value of purchases made at 10am.
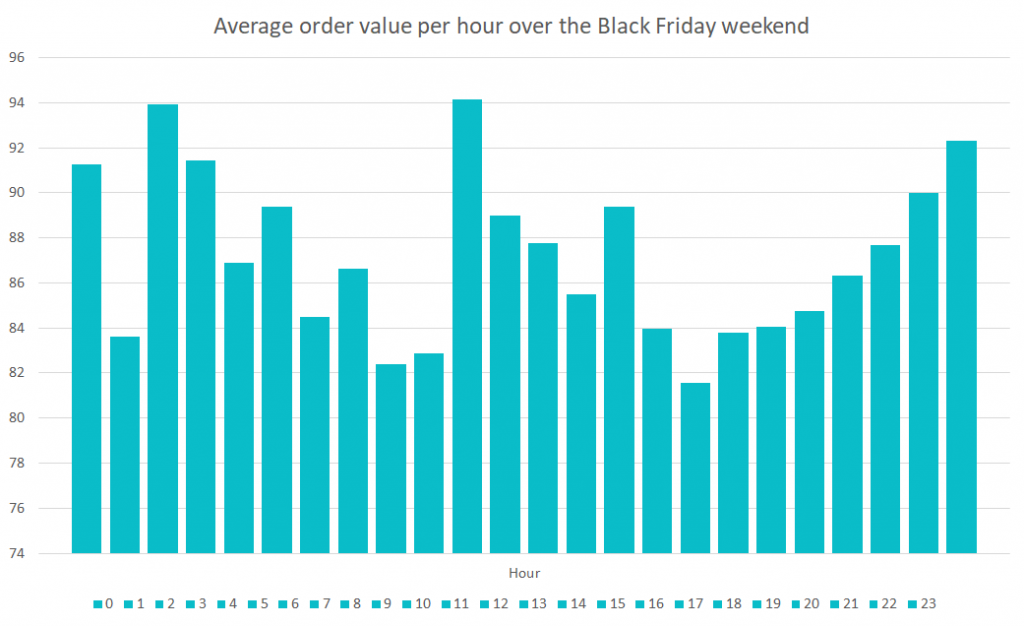
Black Friday was not the best performing day when it comes to average order value – this was the Monday of the week leading up to Black Friday.
Average number of Black Friday items ordered
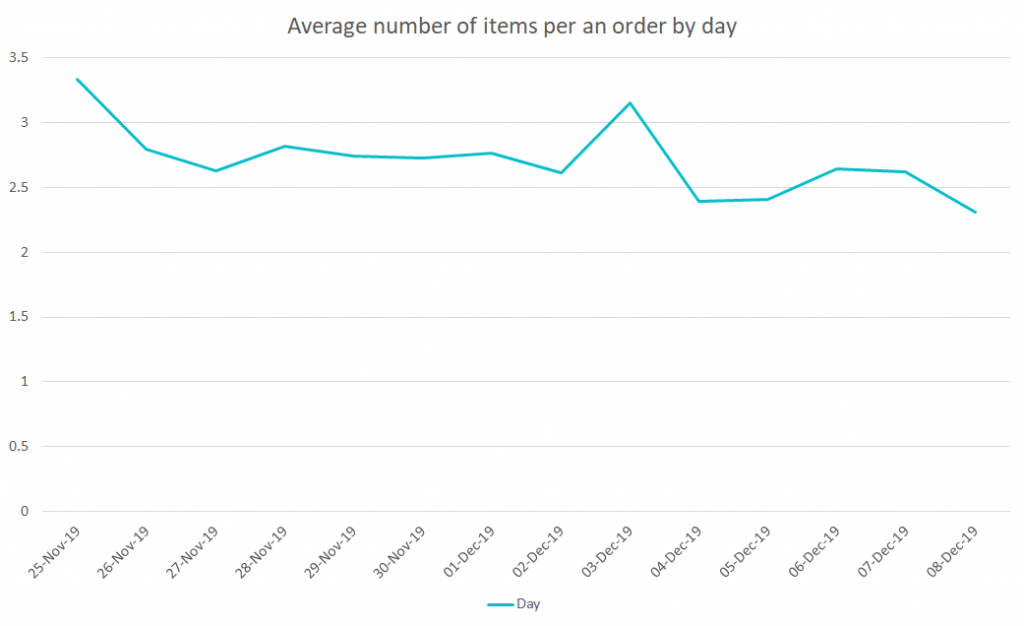
On average, 2.77 items were ordered per purchase. Customers purchased more items using a desktop.
The highest performing hour was 2am, with 3.16 items per purchase. Which was also one of the highest performing hour of the day for average order value.
The highest performing day was the Monday of the week leading up to Black Friday and the Tuesday after Cyber Monday. These were the only days to average over three items per purchase.
What can we conclude about buyers’ behaviour on Black Friday?
According to our data, most customers prefer to search for Black Friday deals and make their purchases using a mobile device. But when it comes to average order value and average number of items per order, desktop comes out on top.
This could be down to customers preferring to research Black Friday deals and make small purchases using their mobile as it’s more convenient. Customers are also more than likely also spend less time deliberating a purchase when its a single item and of smaller value.
However, when it comes to larger orders (both in number of items and value) customers will spend time researching the product on their desktop, and ultimately make the purchase on there.
The Monday of the week leading up to Black Friday performs well in average order value, average number of items and number of items purchased.
This could be because Black Friday customers have identified the item(s) they want to purchase, but are waiting for them go on sale. And once they do they buy their items as soon as possible.